Swing trading is an active form of trading lying in the middle between day trading and trend trading. Trend following or long-term trading seeks to hold positions for many weeks or months for every trade. As the name implies, trend following requires a trend. The challenge is finding a trend. Most markets DONʼT trend but a fraction of the time. It is said that markets are in congestion, the opposite of trending, as much as 75 to 85% of the time. This does not leave many opportunities to trade.
The opposite end of the spectrum is day-trading. Day traders look to enter and exit a trade between the open and close of the same day. This can require near constant monitoring of price action throughout the day. Sometimes, all day.
Whatʼs left? Swing trading! This is trying to capture the waves up and down in the markets. Swing trading is possible in trending and non-trending markets. Thus giving it an advantage over trend-following. Further, constant monitoring of price action intra-day may not be required as is the case with many daytrade systems.
Swing trading takes advantage of the belief that markets act in 2 to 5 day moves on average. A market can have 2 to 5 days up. Followed by 2 to 5 days sideways. Followed by 2 to 5 days down. Then another 2 to 5 days up.
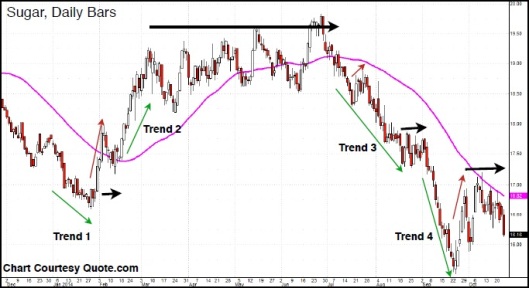
Below is a chart of Sugar for so far in 2014. The Green arrows are when the market is trending. the red arrows are counter-trend moves and the black arrows are congestion. For our purposes here, we define a trend to be a market making significant new daily highs above an upsloping 50 day moving average(shown). Or, making significant new daily lows below a downsloping 50 day moving average.
Of the four numbered trend phases, trend numbers 1, 2 and 4 showed dramatic counter trend moves to end the trend. This wiped out much of a trend followers profits.